The 2026 midterms, analyzed
Who paid for the Senate and House races, what their online ads argued and how, the rhetorical techniques in them, the claims we checked, and how it came out. Every figure comes from the sources in the methods.
Key findings
Outside groups reported spending $3.69B in the 474 Senate and House races, more than the $3.33B the candidates raised themselves: $1.91B for Republicans or against Democrats, $1.71B for Democrats or against Republicans, and $78.5M for or against other candidates.
Source: FEC filings: candidates' reports through 2026-10-22, and outside groups' independent expenditures. The detail · Link to this finding · Share image: link preview, square
68% of the outside money ($2.50B) was spent against a candidate rather than for one, on both sides: 70% of the money on the Republican side and 65% on the Democratic side.
Source: FEC independent-expenditure reports. The detail · Link to this finding · Share image: link preview, square
The 25 largest individual donors to these outside groups gave at least $1.03B; split by how each group spent its money, $849.0M went to the Republican side and $173.0M to the Democratic side.
Source: FEC bulk receipts of 2026-11-09; each group's five largest donors of $100,000 or more, so every total is a floor. The detail · Link to this finding · Share image: link preview, square
In 330 of 366 called races between two nominees (90%), the winner had more money behind them (Democrats won 202 of those races, Republicans 128), which doesn't show the money decided them: incumbents and favorites raise more.
Source: FEC filings; the Associated Press's race calls. The detail · Link to this finding · Share image: link preview, square
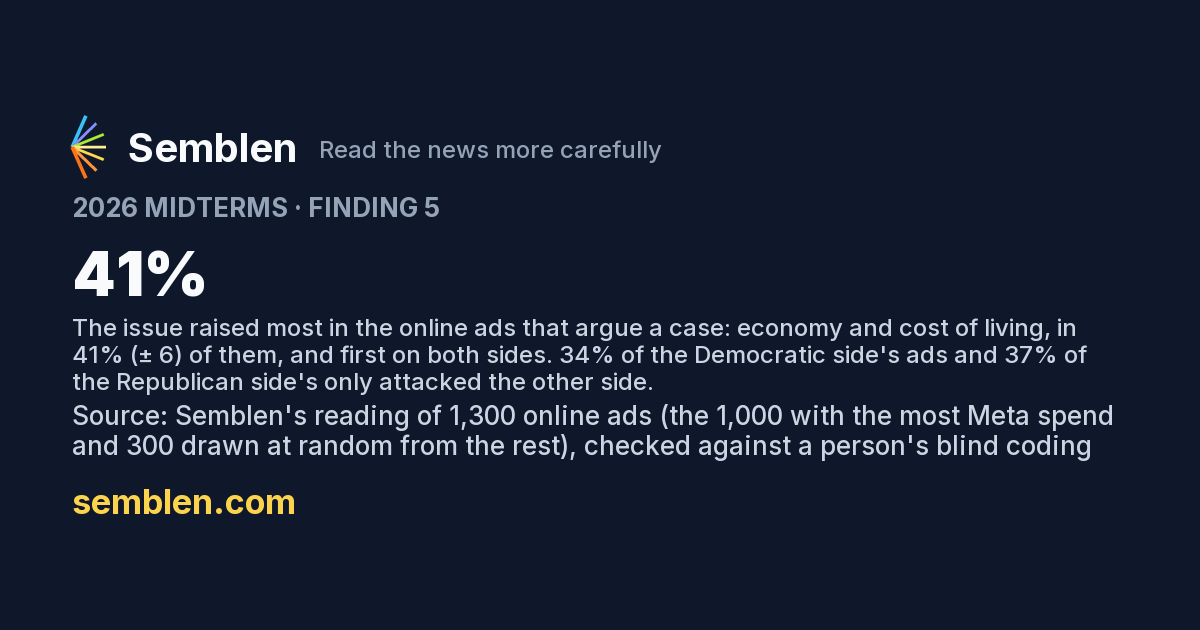
The issue raised most in the online ads that argue a case: economy and cost of living, in 41% (± 6) of them, and first on both sides. 34% of the Democratic side's ads and 37% of the Republican side's only attacked the other side.
Source: Semblen's reading of 1,300 online ads (the 1,000 with the most Meta spend and 300 drawn at random from the rest), checked against a person's blind coding. The detail · Link to this finding · Share image: link preview, square
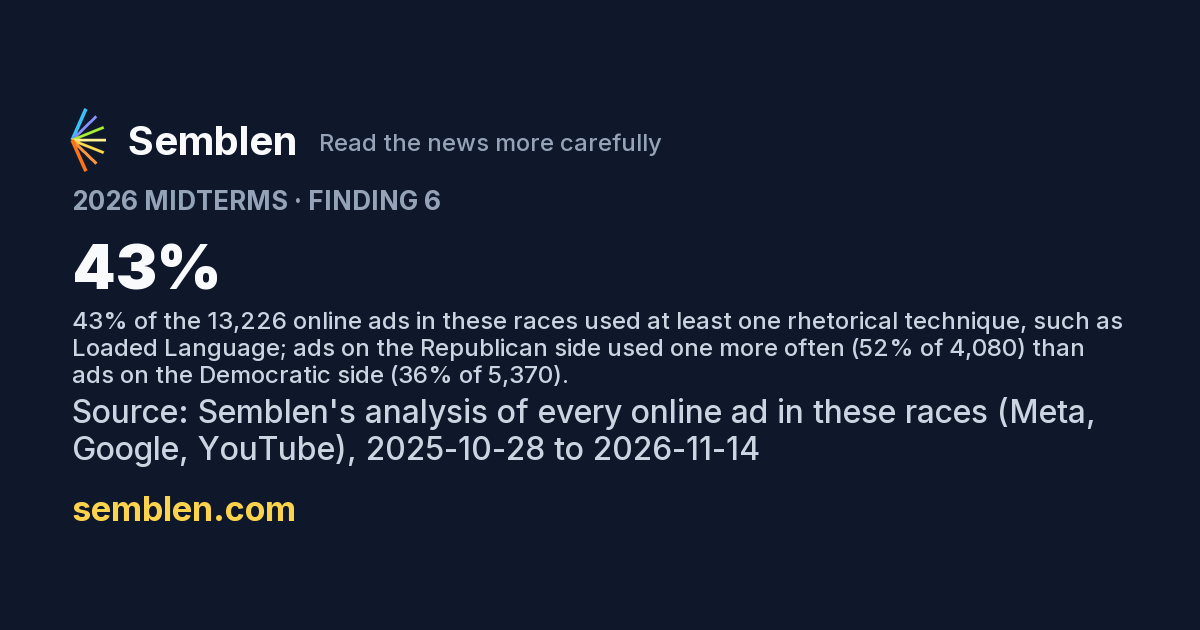
43% of the 13,226 online ads in these races used at least one rhetorical technique, such as Loaded Language; ads on the Republican side used one more often (52% of 4,080) than ads on the Democratic side (36% of 5,370).
Source: Semblen's analysis of every online ad in these races (Meta, Google, YouTube), 2025-10-28 to 2026-11-14. The detail · Link to this finding · Share image: link preview, square
46 of 1,060 ads whose claims we checked (4%) had a claim the sources contradict or that leaves out context that changes it: 22 of 535 on the Democratic side and 17 of 363 on the Republican side. The ads were chosen by readers and by reach, not at random.
Source: Semblen's claim checks, against fact-checkers, official data and the public record. The detail · Link to this finding · Share image: link preview, square
The side of an ad is its sponsor's, never a reading of the ad; the side of outside money is the candidate it was spent for or against (how). Each finding gives both sides' figures.
How it was paid for
The money in 35 Senate and 439 House races, added up from the campaigns' and outside groups' own reports to the Federal Election Commission. Candidates' figures run through their latest reports, the most recent ending 2026-10-22.
Senate: $1.29B raised, $2.37B from outside groups. House (435 seats and 4 non-voting delegates): $2.04B raised, $1.33B from outside groups. Governor races are state elections with no FEC filings, so they aren't in these totals.
The largest outside spenders
Groups that reported spending for or against a candidate (independent expenditures), summed over every race they spent in.
The donors behind them
What each donor gave the groups above. We keep each group's five largest donors of $100K or more, so every figure here is a floor. It is what they gave the groups over the whole cycle, not money traced to any one race. FEC bulk data of 2026-11-09.
People
| Donor | Gave | To |
|---|---|---|
| Elon MuskSpace Exploration Technologies Corp. | $424.0M | AMERICA PAC $216.0M; SLF PAC $168.0M; CLF $30.0M; FIGHT FOR KENTUCKY $10.0M |
| Richard E UihleinUline | $137.7M | RESTORATION OF AMERICA PAC $136.7M; NORTHWOODS FUTURE PAC $1.0M |
| Jeff YassSIG | $70.7M | SCHOOL FREEDOM FUND $17.5M; CLUB FOR GROWTH ACTION $16.5M; MAGA INC. $16.0M; PROTECT FREEDOM POLITICAL ACTION COMMITTEE $12.5M; WIN IT BACK PAC $4.5M; GREAT OPPORTUNITY PAC, INC. $1.2M; TRUTH AND COURAGE PAC $1.0M; ALABAMA FREEDOM FUND $1.0M; SCHOOL FREEDOM FUND $400K |
| Miriam AdelsonAdelson Drug Clinic | $66.0M | SLF PAC $30.0M; MAGA INC. $25.0M; CLF $10.0M; SECURITY IS STRENGTH PAC $1.0M |
| Michael R BloombergBloomberg INC | $54.5M | EVERYTOWN FOR GUN SAFETY VICTORY FUND (EVERYTOWN VICTORY FUND) $24.0M; STAND FOR NEW YORK PAC $11.0M; 314 ACTION FUND $6.4M; LCV VICTORY FUND $5.0M; WOMEN VOTE $2.5M; LONE STAR RISING PAC $2.5M; PLANNED PARENTHOOD VOTES $1.0M; HUMAN RIGHTS CAMPAIGN EQUALITY VOTES PAC $1.0M; INVEST IN TOMORROW COALITION PAC $1.0M; OUR FUTURE UNITED PAC $100K |
| Paul Elliott SingerEMC | $33.6M | SLF PAC $14.5M; CLF $8.0M; AMERICA 21 PAC $3.0M; UNITED DEMOCRACY PROJECT ('UDP') $2.6M; CONSERVATIVES FOR AMERICAN EXCELLENCE INC. $1.9M; MAGA KY $1.0M; SECURITY IS STRENGTH PAC $750K; FIGHT TO WIN AMERICA, INC. $650K; LAST FRONTIER PAC $500K; WFW ACTION FUND INC $250K; DEFENDING AMERICA'S FUTURE $200K; AMERICAN LIBERTY FOUNDATION $200K |
| Reid HoffmanGreylock Partners | $32.0M | LONE STAR RISING PAC $16.5M; HMP $8.5M; GOVERNMENT THAT WORKS PAC $5.5M; NEW ENGAGEMENT PAC $1.0M; MONTANA VOTERS PAC $500K |
| Diane HendricksHendricks Holding CO Inc. | $30.0M | MAGA INC. $30.0M |
| Stephen A SchwarzmanBlackstone | $21.4M | SLF PAC $17.0M; PINE TREE RESULTS PAC $2.0M; PINE TREE RESULTS PAC $2.0M; AMERICA 21 PAC $400K |
| Timothy MellonSelf-Employed | $21.0M | CLF $21.0M |
| Association Nea Advocacy FundNEA | $16.9M | NEA ADVOCACY FUND $16.9M |
| Kenneth GriffinCitadel LLC | $14.5M | CONSERVATIVES FOR AMERICAN EXCELLENCE INC. $3.0M; AMERICAN PATRIOTS PAC $2.5M; LAST FRONTIER PAC $2.5M; PINE TREE RESULTS PAC $2.5M; STRONGER SAFER NATION $2.5M; FIGHT ON IOWA $1.5M |
| Deborah SimonRetired | $12.8M | AB PAC $5.0M; DMFI PAC $3.5M; PLANNED PARENTHOOD VOTES $3.0M; FF PAC $1.0M; NEW ENGAGEMENT PAC $250K |
| Jay Robert PritzkerState OF Illinois | $10.0M | ILLINOIS FUTURE PAC $10.0M |
| Jb PritzkerState OF Illinois | $10.0M | READY FOR THE FIGHT $10.0M |
| Michael T RydinRetired | $9.5M | FREEDOM CAUCUS FUND $8.8M; SENATE CONSERVATIVES ACTION $500K; HOUSE FREEDOM ACTION $195K |
| Timothy M DunnCrownquest Operating | $9.3M | GLCF, INC. $5.0M; JEFFERSON RISING $3.0M; PROTECTING AMERICA'S FUTURE $1.3M |
| Thomas KlingensteinOhen, Klingenstein, & Marks | $9.0M | CIVIC RENEWAL FUND INC. $5.0M; FIGHT FOR KENTUCKY $2.5M; AMERICAN PRINCIPLES PROJECT PAC $1.5M |
| Stephen MandelSelf Employed | $7.7M | THE BENCH $7.4M; NORTH STAR DAWN PAC $300K |
| Jim C WaltonArvest Bank | $7.2M | AMERICANS FOR PROSPERITY ACTION, INC. (AFP ACTION) DBA CVA ACTION AND DBA LIBRE ACTION $7.0M; CHARTER SCHOOLS ACTION PAC $200K |
| S Robson WaltonRetired | $7.2M | AMERICANS FOR PROSPERITY ACTION, INC. (AFP ACTION) DBA CVA ACTION AND DBA LIBRE ACTION $7.0M; CONSERVATIVES FOR AMERICA PAC $200K |
| Stephen III PajcicPajcic & Pajcic | $7.1M | NEW DEAL FOR ALL, INC. $5.6M; FREEDOM FROM POLITICS, INC. $1.2M; NEW ENGAGEMENT PAC $263K |
| John L III NauSED Holdings | $7.0M | TEXANS FOR A CONSERVATIVE MAJORITY $6.9M; ASSOCIATION OF TEXAS CONSERVATIVES $100K |
| Christian LarsenRipple | $6.3M | YOU CAN PUSH BACK $4.5M; LONE STAR RISING PAC $1.8M |
| Chris LarsenRipple Inc. | $6.1M | INVEST IN TOMORROW COALITION PAC $6.0M; NEW ERA LEADERSHIP $100K |
Organizations
| Donor | Gave | To |
|---|---|---|
| SMP | $246.5M | WINSENATE $85.0M; WINSENATE $69.1M; LOWER COSTS NOW $23.0M; DUTY AND COUNTRY $17.5M; TEXAS FOREVER $12.2M; NORTH STAR $12.2M; DEFEND THE VOTE $11.7M; THE GEORGIA WAY $8.5M; LOWER COSTS NOW $7.0M; AMERICAN DEMOCRACY PROJECT $300K |
| MAGA INC. | $225.6M | NO GOING BACK PAC INC. $200.0M; SAFETY & AFFORDABILITY PAC INC. $25.0M; MAGA KY $560K |
| SLF PAC | $184.7M | TEXAS PAC $158.0M; THE MAINE STANDARD $9.5M; CORNHUSKER MAJORITY $7.5M; LONE STAR LIBERTY PAC $5.0M; PLAINS PAC $2.7M; 75 PAC $1.4M; 59 PAC $541K |
| FAIRSHAKE | $139.0M | DEFEND AMERICAN JOBS $106.0M; PROTECT PROGRESS $33.0M |
| ONE NATIONan organization: its own funders aren't reported to the FEC | $132.9M | SLF PAC $132.9M |
| HOUSE MAJORITY FORWARDan organization: its own funders aren't reported to the FEC | $93.7M | HMP $93.7M |
| AMERICAN ACTION NETWORKan organization: its own funders aren't reported to the FEC | $64.3M | CLF $64.3M |
| CONSERVATIVE AMERICANS PAC | $52.5M | GLCF, INC. $10.1M; CONSERVATIVES FOR AMERICAN EXCELLENCE INC. $8.3M; CONSERVATIVE TEXANS PAC $5.0M; TEXANS DEMANDING ACCOUNTABILITY $3.7M; STRATEGIC MAJORITY PAC $3.5M; LEAD LEFT PAC $3.2M; PALMETTO ACTION $2.5M; ENOUGH PROMISES OHIO $2.5M; PALMETTO ACTION $1.8M; MICHIGAN SUNRISE PAC $1.8M; PROGRESSIVE CHAMPIONS PAC $1.6M; CALIFORNIA CONSERVATIVES PAC $1.5M; REAL CHANGE PAC $1.2M; CALIFORNIA BLUE PAC $1.1M; AMERICANS 4 SECURITY PAC $1.0M; CONSERVATIVES FOR AMERICAN EXCELLENCE INC. $1.0M; COMMITTEE FOR AMERICAN LEADERSHIP $1.0M; KEEP AMERICA GREAT PAC, INC. $750K; FIGHT TO WIN AMERICA, INC. $500K; HONEST CHOICE MAINE $500K |
| RIPPLE LABS INC.an organization: its own funders aren't reported to the FEC | $49.5M | FAIRSHAKE $48.0M; COMMONWEALTH PROSPERITY FUND $1.0M; DEFEND AMERICAN JOBS $250K; PROTECT PROGRESS $250K |
| RESTORATION OF AMERICA PAC | $47.9M | CLUB FOR GROWTH ACTION $15.0M; AMERICAN MAJORITY ACTION PAC $10.9M; CLUB FOR GROWTH ACTION $6.8M; AMERICAN MAJORITY ACTION PAC $4.1M; THE SENTINEL ACTION FUND $3.0M; MORE JOBS, LESS GOVERNMENT $2.0M; LAST FRONTIER PAC $2.0M; CATHOLIC ENGAGEMENT PAC $1.1M; RED BRIDGE LEADERSHIP PAC $1.0M; TEA PARTY PATRIOTS CITIZENS FUND $520K; TEA PARTY PATRIOTS CITIZENS FUND $509K; WYOMING WAY ACTION PAC $500K; CATHOLIC ENGAGEMENT PAC $455K |
| LEADING THE FUTURE | $47.0M | AMERICAN MISSION $22.5M; THINK BIG $22.5M; THINK BIG $2.0M |
| GOPAC INCan organization: its own funders aren't reported to the FEC | $43.6M | GOPAC ELECTION FUND $43.6M |
| KOCH INCan organization: its own funders aren't reported to the FEC | $40.0M | AMERICANS FOR PROSPERITY ACTION, INC. (AFP ACTION) DBA CVA ACTION AND DBA LIBRE ACTION $40.0M |
| GEMINI TRUST COMPANYan organization: its own funders aren't reported to the FEC | $35.9M | MAGA INC. $24.4M; DIGITAL FREEDOM FUND $11.4M |
| FORIS DAX, INC.an organization: its own funders aren't reported to the FEC | $35.4M | MAGA INC. $35.0M; FIGHT ON IOWA $400K |
| DEMOCRACY MATTERS | $34.6M | AB PAC $14.0M; PROJECT 218 $12.9M; UNITE TO WIN $4.0M; UNITE TO WIN $1.4M; VOTEVETS $1.4M; NEBRASKA VALUES PAC $850K |
| LEAGUE OF CONSERVATION VOTERS, INC.an organization: its own funders aren't reported to the FEC | $32.1M | LCV VICTORY FUND $31.0M; GIVEGREEN UNITED ACTION $1.1M |
| GOVERNMENT THAT WORKS PAC | $31.1M | VOTEVETS $6.9M; NEBRASKA VALUES PAC $4.4M; LONE STAR RISING PAC $3.8M; WORKING CLASS MAJORITY PAC, INC $2.8M; NEBRASKA VALUES PAC $2.8M; MONTANA FREEDOM PAC $2.8M; YOUR COMMUNITY PAC $1.6M; PROJECT 218 $1.0M; MONTANA VOTERS PAC $820K; COMMONSENSE HOOSIERS PAC $750K; BLACKPAC $500K; FIGHT FOR NEBRASKA PAC $500K; WHEEL DOG PAC $500K; MIDNIGHT SUN PAC $500K; KENTUCKIANS NOT CORRUPTION $500K; RETIRE CAREER POLITICIANS $250K; THE 1861 INITIATIVE $250K; INNOVATION OHIO PAC $250K; OUR VIRGINIA $150K; PEOPLE OVER POLITICS ACTION FUND $100K |
| AMERICAN ISRAEL PUBLIC AFFAIRS COMMITTEEan organization: its own funders aren't reported to the FEC | $30.0M | UNITED DEMOCRACY PROJECT ('UDP') $30.0M |
| STAND TOGETHER INC.an organization: its own funders aren't reported to the FEC | $28.0M | AMERICANS FOR PROSPERITY ACTION, INC. (AFP ACTION) DBA CVA ACTION AND DBA LIBRE ACTION $28.0M |
| CENTER FORWARDan organization: its own funders aren't reported to the FEC | $26.5M | A STRONGER MICHIGAN $17.8M; CENTER FORWARD COMMITTEE $4.5M; PINE TREE RESULTS PAC $1.8M; CENTER FORWARD INITIATIVE INC (CFI) $1.4M; STRONGER MAINE $1.0M |
| COINBASEan organization: its own funders aren't reported to the FEC | $25.1M | FAIRSHAKE $25.0M; ROLLING SEA ACTION FUND $100K |
| CLUB FOR GROWTH ACTION | $24.6M | WIN IT BACK PAC $10.8M; WIN IT BACK PAC $4.4M; ALABAMA FREEDOM FUND $3.4M; STRONG PAC $2.2M; MORE JOBS, LESS GOVERNMENT $1.9M; AMERICAN VALUES FIRST $1.3M; DEFENDING CONSERVATIVE VALUES PAC $300K; ALAMO FREEDOM FIGHTERS PAC $200K; DELIVERING FOR AMERICA PAC $100K |
| WINKLEVOSS CAPITAL FUND, LLCan organization: its own funders aren't reported to the FEC | $21.3M | DIGITAL FREEDOM FUND $21.3M |
| FF PAC | $20.4M | LOWER COSTS NOW $20.0M; STRONGER TOGETHER PA $350K |
The most expensive races
The candidates' own money plus outside spending for or against them.
| Race | Total | Candidates | Outside groups | Result |
|---|---|---|---|---|
| Texas Senate | $686.3M | $198.2M | $488.1M | James Talarico won |
| Ohio Senate | $511.3M | $93.5M | $417.9M | Sherrod Brown won |
| Michigan Senate | $439.5M | $100.8M | $338.7M | Abdul El-Sayed won |
| Iowa Senate | $253.4M | $43.0M | $210.4M | Josh Turek won |
| Maine Senate | $232.4M | $83.9M | $148.4M | Troy Jackson won |
| Georgia Senate | $173.0M | $134.5M | $38.5M | Jon Ossoff won |
| Alaska Senate | $153.9M | $48.4M | $105.5M | Mary Peltola won |
| North Carolina Senate | $146.9M | $68.8M | $78.1M | Roy Cooper won |
| Kansas Senate | $119.0M | $25.9M | $93.2M | Adam Hamilton won |
| South Carolina Senate | $113.3M | $42.6M | $70.8M | Annie Andrews won |
| New Hampshire Senate | $100.9M | $32.3M | $68.6M | Chris Pappas won |
| Nebraska Senate | $97.0M | $25.6M | $71.3M | Pete Ricketts won |
| Florida Senate | $84.7M | $59.0M | $25.6M | Ashley Moody won |
| Illinois Senate | $75.1M | $49.8M | $25.3M | Juliana Stratton won |
| Kentucky Senate | $70.9M | $30.1M | $40.8M | Andy Barr won |
| Louisiana Senate | $60.3M | $33.6M | $26.6M | Julia Letlow won |
| New York House District 17 | $60.1M | $37.2M | $22.9M | Cait Conley won |
| Michigan House District 7 | $59.0M | $17.7M | $41.3M | William Lawrence won |
| Minnesota Senate | $55.1M | $27.2M | $27.9M | Peggy Flanagan won |
| Colorado House District 8 | $54.2M | $20.3M | $33.8M | Manny Rutinel won |
| Arizona House District 1 | $53.5M | $21.5M | $32.0M | Amish Shah won |
| North Carolina House District 1 | $51.0M | $15.1M | $35.9M | Don Davis won |
| Florida House District 25 | $49.4M | $13.5M | $35.9M | Jared Moskowitz won |
| Wisconsin House District 3 | $45.9M | $22.5M | $23.4M | Rebecca Cooke won |
| California House District 22 | $44.7M | $13.9M | $30.9M | Randy Villegas won |
In 330 of 366 called races between two nominees, the winner had more money behind them: their own, outside spending for them, and outside spending against their opponent. That doesn't say money decided them: incumbents raise more and win more, and money follows likely winners as much as it makes them.
What the online ads argued, and how
We read 1,300 of the 13,133 distinct online ads: the 1,000 with the most Meta spend, which carry most of the money, and 300 drawn at random from the rest. 1,137 of them argue a case: for or against a candidate, a party or a position. Those are the ads counted here. Ads that only ask for money, a vote or a volunteer are left out (how).
Tone
The Wesleyan Media Project's categories. Attack: only criticises the other side. Contrast: praises one side and criticises the other. Promote: only praises the sponsor's side. "All ads" counts each distinct ad once, with a 95% margin of error from the random draw. "By spend" weighs each ad by what was spent on it on Meta.
| Tone | All ads | By spend |
|---|---|---|
| Promote | 37% ± 5% | 29% |
| Attack | 36% ± 5% | 48% |
| Contrast | 23% ± 5% | 22% |
| Neither | 3% ± 2% | 0% |
Issues
The share of the ads that raise each issue. An ad can raise up to three, so these add up to more than 100%.
| Issue | All ads | By spend |
|---|---|---|
| Economy and cost of living | 41% ± 6% | 34% |
| Corruption and character | 31% ± 5% | 40% |
| Health care | 18% ± 4% | 14% |
| Taxes | 16% ± 4% | 18% |
| Another issue | 14% ± 4% | 13% |
| Energy and climate | 10% ± 3% | 12% |
| Crime and public safety | 10% ± 3% | 10% |
| Foreign policy and defense | 9% ± 3% | 6% |
| Education | 8% ± 3% | 4% |
| Democracy and elections | 6% ± 3% | 6% |
| Immigration | 3% ± 2% | 4% |
| Abortion | 2% ± 1% | 2% |
| Medicare and Social Security | 1% ± 1% | 2% |
| Guns | 1% ± 1% | 1% |
Frames
The angle an ad takes on its issue, from the Media Frames Corpus: the same frames our story pages find in the news.
| Frame | All ads | By spend |
|---|---|---|
| Political | 76% ± 5% | 74% |
| Economic | 50% ± 6% | 42% |
| Policy prescription and evaluation | 42% ± 6% | 37% |
| Quality of life | 36% ± 5% | 31% |
| Morality | 19% ± 4% | 25% |
| Health and safety | 18% ± 4% | 16% |
| Fairness and equality | 13% ± 4% | 15% |
| Capacity and resources | 10% ± 3% | 5% |
Who the criticism names
| Named | All ads | By spend |
|---|---|---|
| The opponent | 48% ± 6% | 55% |
| A group or industry | 4% ± 2% | 6% |
| The other party | 3% ± 2% | 5% |
| A national figure | 3% ± 2% | 4% |
By side
The side the sponsor is on, from the data, never from the ad: a nominee's campaign, a party committee, or an outside group that told the FEC which nominee it spent for or against. The race pages use the same rule.
| Side | Ads | Attack | Contrast | Promote | Issues raised most |
|---|---|---|---|---|---|
| Democratic side | 473 | 34% | 26% | 34% | Economy and cost of living, Corruption and character, Health care |
| Republican side | 403 | 37% | 19% | 44% | Economy and cost of living, Taxes, Corruption and character |
| Sponsor not placed on a side | 261 | 39% | 24% | 35% | Economy and cost of living, Corruption and character, Health care |
How the ads were read
A language model (Claude) read each ad against a fixed rubric, written and agreed before any ad was read. It labelled the ad's purpose, then for ads that argue a case, its tone, up to three issues, its frames and who it criticises. Every issue, frame and target needs a quote found word for word in the ad, or it is dropped. The side a sponsor is on comes from the data, never from the model.
What the 1,300 ads set out to do: argue a case 85%; something else 5%; ask for money 5%; ask for a vote or a volunteer 4%. Only the ads that argue a case are counted above, even when they also ask for money or a vote: an ad that only says "chip in $5" or "vote on November 3" has no tone or frame to count.
To check the model, a person coded 50 of the ads without seeing its labels. They agreed on purpose for 44 of 50 ads (Cohen's κ 0.36) and on tone for 33 of 42 ads that both said argue a case (κ 0.66). κ for purpose is low because nine in ten ads argue a case, which leaves too few of the rest to measure on. Most of the disagreements were the person coding an ad's main purpose or tone where the rubric counts any argument and any praise. So an ad that mostly attacks but also praises its own candidate is a contrast here.
The rhetorical techniques in them
Every one of the 13,226 online ads in these races was analysed for rhetorical techniques, the same analysis as on each race page. 43% (5,630 ads) use at least one, and those ads carried 56% of the Meta spend. A technique is a choice of words meant to persuade, not a falsehood: an ad can use one and be accurate.
| Technique | Ads | Share of ads |
|---|---|---|
| Loaded Language | 2,998 | 23% |
| Glittering Generalities | 2,427 | 18% |
| Name Calling | 1,998 | 15% |
| Appeal to Fear | 1,043 | 8% |
| Exaggeration/Hyperbole | 919 | 7% |
| Black-and-White Fallacy | 674 | 5% |
| Card Stacking | 532 | 4% |
| Bandwagon Appeal | 394 | 3% |
| False Urgency | 386 | 3% |
| Appeal to Prejudice | 204 | 2% |
By side
The share of each side's ads that use each technique. The side is the sponsor's, by the same rule as above.
| Technique | Democratic side5,370 ads | Republican side4,080 ads | Sponsor not placed on a side3,776 ads |
|---|---|---|---|
| Any technique | 36% | 52% | 42% |
| Loaded Language | 22% | 25% | 21% |
| Glittering Generalities | 14% | 23% | 20% |
| Name Calling | 12% | 22% | 12% |
| Appeal to Fear | 5% | 13% | 7% |
| Exaggeration/Hyperbole | 6% | 9% | 6% |
| Black-and-White Fallacy | 4% | 6% | 6% |
| Card Stacking | 3% | 6% | 3% |
| Bandwagon Appeal | 2% | 3% | 5% |
| False Urgency | 4% | 2% | 2% |
| Appeal to Prejudice | 0% | 4% | 1% |
By who paid for the ad
| Sponsor | Ads | Any technique | Most common |
|---|---|---|---|
| Candidates' campaigns | 7,422 | 42% | Glittering Generalities, Loaded Language, Name Calling |
| Party committees | 361 | 61% | Loaded Language, Name Calling, Glittering Generalities |
| Outside groups | 5,429 | 42% | Loaded Language, Name Calling, Glittering Generalities |
A campaign is a nominee's own committee; a party committee is a national or state party's. Everyone else is an outside group. Ads in races with fewer than five ads aren't placed.
By tone
The ads read for framing above, joined to their techniques: how often an ad of each tone uses one.
| Tone | Ads read | Any technique | Most common |
|---|---|---|---|
| Promote | 329 | 39% ± 9% | Glittering Generalities 29%, Loaded Language 7%, Slogans 7% |
| Contrast | 246 | 67% ± 11% | Loaded Language 39%, Glittering Generalities 32%, Name Calling 28% |
| Attack | 517 | 60% ± 9% | Loaded Language 40%, Name Calling 32%, Appeal to Fear 25% |
| Neither | 15 | 1% ± 1% | Appeal to Fear 1%, Black-and-White Fallacy 1%, Appeal to Prejudice 0% |
The claims we checked
We checked the factual claims in 1,060 ads: 1,237 claims, each against named sources (fact-checkers, official data and the public record). 46 of those ads (4%) have at least one claim the sources contradict or that leaves out context that changes it.
Not a sample. These ads were checked because readers asked or because they reached the most people, so the figures describe what those checks found. They don't say how accurate the ads were overall, or which side's ads were more accurate.
| Verdict | Claims | Share |
|---|---|---|
| Supported | 155 | 13% |
| Contradicted | 9 | 1% |
| True, but missing context | 47 | 4% |
| Sources don't settle it | 1,026 | 83% |
By side
| Side | Ads | Claims | Supported | Contradicted | Missing context | Not settled |
|---|---|---|---|---|---|---|
| Democratic side | 535 | 679 | 15% | 0% | 4% | 81% |
| Republican side | 363 | 370 | 9% | 1% | 4% | 86% |
| Sponsor not placed on a side | 162 | 188 | 11% | 1% | 3% | 85% |
By who paid for the ad
| Sponsor | Ads | Claims | Supported | Contradicted | Missing context | Not settled |
|---|---|---|---|---|---|---|
| Candidates' campaigns | 691 | 754 | 13% | 1% | 4% | 82% |
| Party committees | 41 | 52 | 17% | 0% | 0% | 83% |
| Outside groups | 319 | 417 | 11% | 1% | 5% | 84% |
Each verdict is the one the ad's card on its race page shows. "Not settled" means the sources we found don't decide it either way; a verdict that rests only on a party's own sources, or that our rules hold back for a person to review, reads as not settled too.
How it came out
501 of the 510 races had been called when this page was last updated. In the 120 called races between two nominees where both sides ran online ads, here are the ads on the winner's side and on the loser's. The side is the sponsor's, by the rule above.
| Winner's side | Loser's side | |
|---|---|---|
| Ads | 5,543 | 4,390 |
| Use a rhetorical technique | 37% | 51% |
| Attack of the ads read for framing that argue a case (477 and 394) | 35% | 33% |
| Contrast | 25% | 22% |
| Promote | 34% | 44% |
| Loaded Language | 22% | 25% |
| Glittering Generalities | 15% | 23% |
| Name Calling | 12% | 20% |
| Appeal to Fear | 5% | 12% |
| Exaggeration/Hyperbole | 6% | 9% |
This sets the two sides beside each other; it doesn't say how the ads affected the result. Incumbents and front-runners can more easily promote themselves, and challengers often have to make the case against. For the money behind the winners, see the most expensive races.
Methods, limits and data
Sources
- Money: the Federal Election Commission. The candidates' own reports (totals through 2026-10-22) and the outside groups' independent-expenditure reports, read nightly; the FEC's bulk receipts files for the donors behind the groups (as of 2026-11-09), read weekly. Final figures come with the post-general reports, due December 3. Each group links to its FEC page.
- Online ads: the Meta Ad Library, the Google Ads Transparency Center and YouTube: ads that started running from 2025-10-28 to 2026-11-14, 13,226 in all. Meta gives each ad's spend as a range; we use its low end.
- Results: the Associated Press's race calls, and a hand-checked file for what AP doesn't give (a runoff, a ranked-choice count, a recount): 501 of 510 races called as of 2026-11-20.
- Claim checks: each factual claim in an ad checked against named sources: fact-checkers, official data and the public record. Each ad's card on its race page shows its sources.
What's counted, and what isn't
- Online ads only (Meta, Google, YouTube). Not broadcast or cable TV, radio, mail or texts, where most ad money goes. "The ads" on this page always means the online ads.
- Outside spending is what groups reported to the FEC as spent for or against a candidate (independent expenditures). Ads that never call for a vote for or against a candidate ("issue ads") aren't in it.
- Donor totals are a floor. We keep each group's five largest donors of $100K or more. A total is what the donor gave the groups over the whole cycle, not money traced to one race. A donor's side splits each gift the way the group spent its money.
- Governor races are state elections with no FEC filings: they're in the ads sections, not the money totals.
- Sides come from the data. An ad's side is its sponsor's: a nominee's campaign, a party committee, or an outside group that told the FEC which nominee it spent for or against. An ad whose sponsor can't be placed is shown apart. Outside money's side is the candidate it was spent for or against: "the Democratic side" is money for Democrats or against Republicans, which includes money against a Democrat in a Democratic primary.
- Claim checks are not a random sample. We checked the ads readers asked about and those that reached the most people, so the figures say what those checks found, not how accurate the ads were overall or which side's were more accurate.
- Framing labels (tone, issues, frames, who an ad criticizes) are a language model's (Claude), read against a fixed rubric on 1,300 ads: the 1,000 with the most Meta spend and 300 drawn at random from the rest, so each share of all ads comes with a margin of error. A person coded 50 of the ads blind, without seeing the labels: they agreed on tone for 33 of 42 (how the ads were read).
- Rhetorical techniques are found in every ad by the same analysis as on each race page. A technique is a choice of words meant to persuade, not a falsehood: an ad can use one and be accurate.
Data
The money tables, every row, as CSV. They are free to reuse under CC BY 4.0: credit Semblen and link to this page.
- The outside groups data/outside-spenders.csv
- The people who gave to them data/donors-people.csv
- The organizations that gave to them data/donors-organizations.csv
- Every race: its money and its result data/races.csv
The figures built on the ads stay on this page: quote them with credit and a link. They aren't offered as a dataset, because the ad platforms' terms govern their data.
How to cite
Semblen, "The 2026 midterms, analyzed," updated November 20, 2026, https://semblen.com/2026-midterms-analysis. A single finding has its own link: https://semblen.com/2026-midterms-analysis#finding-1.
Contact
Questions, corrections, or using this in a newsroom or a course: hello@semblen.com.